Transportation Incident Analytics
Project information
- Category: Data Visualization
- Project date: December, 2023
- Skills: PowerBI, KPIs, ETL, SQL
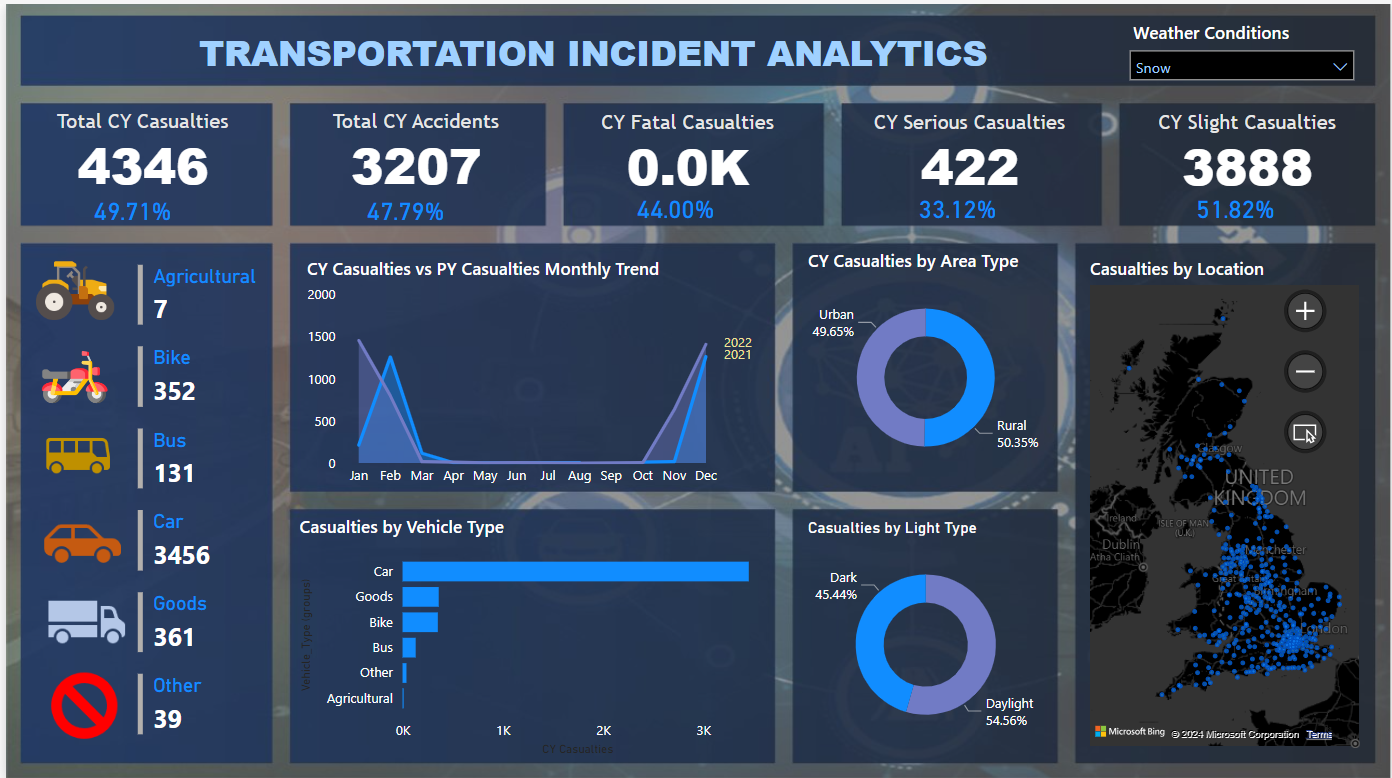
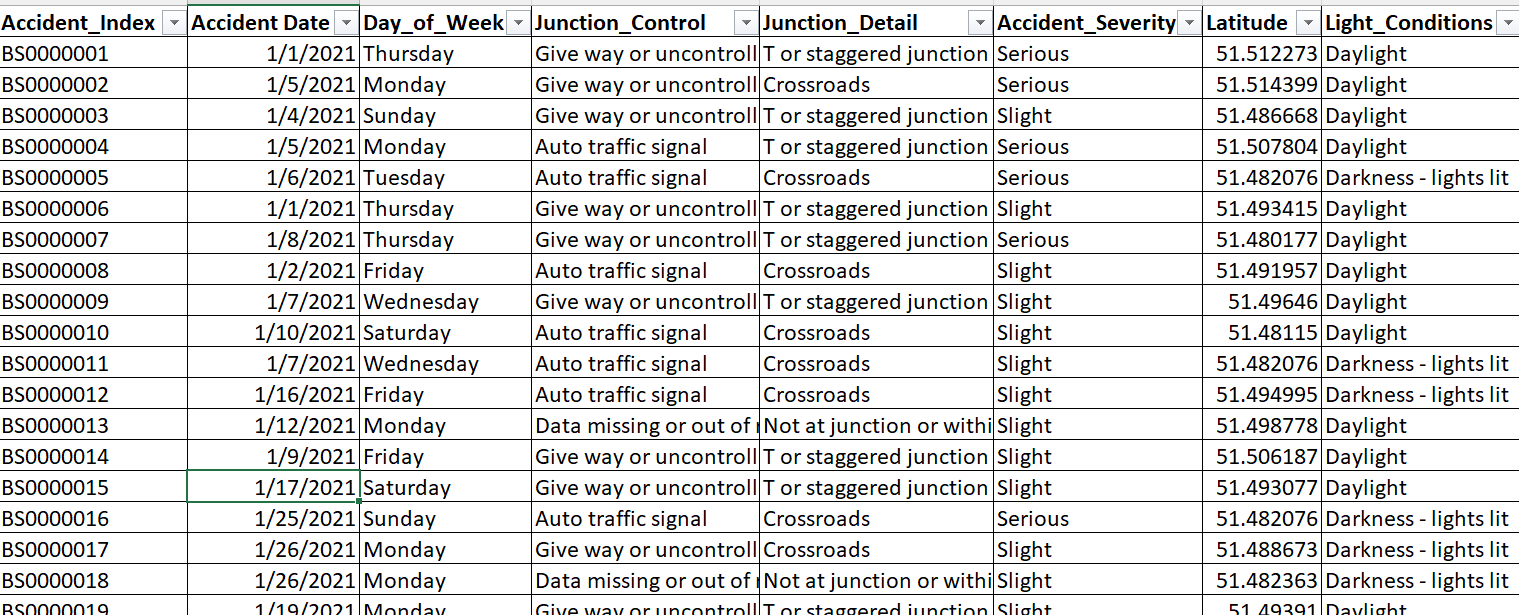
Road accidents are a significant public safety issue in United Kingdom, leading to numerous casualties each year. Understanding the patterns and causes of these accidents is crucial for implementing effective safety measures and policies. However, analyzing and interpreting accident data can be complex due to the volume and variety of data involved. Different types of vehicles, such as buses, cars, and bikes, contribute to accidents in distinct ways, and the severity of casualties can range from slight injuries to serious injuries and fatalities.
Solution OverviewThis project addresses this need by developing a powerful data visualization tool using Power BI to analyze and present road accident data in UK. The tool focuses on key performance indicators (KPIs) such as total casualties, serious casualties, and slight casualties, categorized by different types of vehicles including buses, cars, and bikes. By leveraging Power BI’s advanced visualization capabilities, we provide a clear and interactive way to explore and understand the patterns and impacts of road accidents, facilitating data-driven decisions to enhance road safety.